
PHYSICAL AND CHEMICAL LIMNOLOGY
OBJECTIVE
There are many physical and chemical parameters of potential interest
to limnologists, but one can infer much about aquatic ecosystems
from a relatively few measurements. This exercise will introduce
you to various physical and chemical measures that are used routinely
in limnological analyses.
Physical/chemical parameters do not differ between Lake Winona
and the lentic backwaters of the Mississippi River during September.
You will collect numerous water samples from east Lake Winona
and from Sam Gordy Slough, a lentic backwater of the Mississippi
River, for use in determining a wide variety of physical and chemical
parameters. In the "field" you will determine water
temperature, dissolved oxygen, conductivity, pH, and turbidity
with the appropriate battery-operated instruments (meters). You
also will use various kits to determine nitrate concentrations
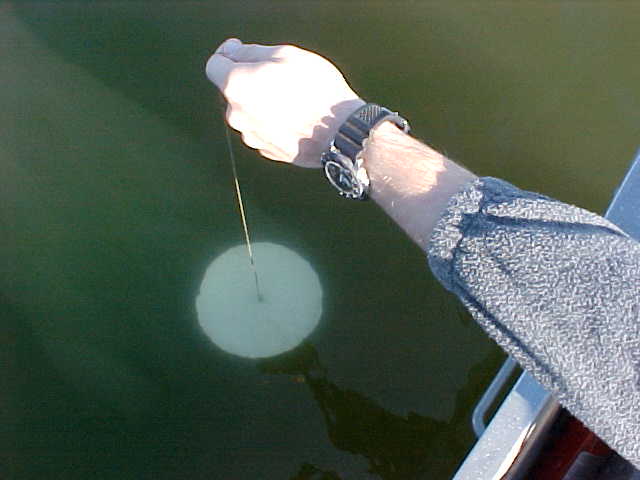
and total hardness. As conditions permit, you also will 1) measure
dissolved oxygen, pH, conductivity, and water temperature at 1-m
intervals from surface to bottom, 2) determine Secchi disc transparency
and light transmittance, and 3) collect water samples from several
depths with a Kemmerer water bottle for analysis (nitrate, hardness,
turbidity) and comparison to the surface samples.
The use of the various instruments will be explained to you during
the lab.
Once all data are collected, calculate means and standard deviations
(where appropriate) for each water body and parameter and construct
a data table. Use the simple statistical software (e.g., VassarStats)
available on the internet to determine whether or
not any of the parameters differ between the lake and backwaters.
The instructor will demonstrate, if needed, the use of the software
either to individuals or to small groups.
Construct a series of figures (graphs) depicting any changes in
the parameters measured (e.g., temperature, DO, pH, etc.) with
depth for your lake and backwater data. Remember, limnologists
like to plot depth along the vertical axis, with surface readings
at the top of the figure (0 in upper left) and increasing depths
extending downward. Changes in water temperature and dissolved
oxygen with depth often are presented (graphed) on the same figure.
Return to Limnology
Lab
Neal D. Mundahl
Winona State University
Winona, MN 55987-5838