|
Guidelines
for Lab Reports
Learning how to effectively
report experimental results is extremely important in
all of the sciences. Although the customary format may
vary between discipline, a scientific report should be
clear, concise, and well organized and should make
effective use of tables and graphs.
Formatting
- Reports should be word-processed and
double-spaced.
- Do not ignore the need for subscripts
and superscripts in chemical formulas. These are
easily available in all modern word processors.
- Use a minimum font size of 11 and left
and right page margins of 1.0".
Conciseness
- Strive to make your report as concise
as possible. A page limit of 12 pages (not counting
attachments) applies to all lab reports. (Please
number the pages!)
- In achieving conciseness, one can use
standard abbreviations and/or chemical formulas (when
unambiguous) in place of full chemical names. For
example write "MeOH" instead of "methanol" and CDCl3
instead of chloroform-d. (However, for
molecular formulas where many isomers are possible it
is not appropriate to use the molecular formula as an
abbreviation for the name.)
- All measurement units have standard
abbreviations and these should always be used in
conjunction with the numerical value for the
measurement, e.g. always write "15 cm" not "15
centimeters" or "fifteen centimeters".
- Use standard symbols and Greek letters
as appropriate for greater conciseness. For example
never write out "degrees Celsius" which should always
be written as °C.
- Here is a spreadsheet
with commonly needed standard abbreviations.
Remember to use these freely (especially in your
results tables) and to not waste space defining them.
- Also consider creating your own
abbreviations to replace long compound names. Define
these simply by placing parentheses immediately after
the first instance of the full compound name in the
report. Current style in most organic chemistry
journals uses bolded numbers for compound
abbreviations.
Graphics/Plagiarism - In addition to
the usual expectations of academic honest please
note the following:
- Every part of the report should be your
team's own work. These include the graphics, which
should not be copied and pasted from the internet or
other sources. There are several molecule
drawing apps available online (see the Links
page) and there is also the option of using a
structure drawing tool from someplace like PubChem and
do a screen shot of the drawing you create.
- The use of an AI "chatbot" to
generate text will be considered a violation of
academic integrity and will be penalized
accordingly.
Data Interpretation
- Students are
encouraged to bring rough drafts and questions about
data interpretation to the instructor prior to
submitting their final report.
Title Page
- Give the number and title of the
experiment, your name, course number and section, and
the date submitted.
Results Tables (The results tables can either be grouped all
together in their own separate section or they can be
interspersed where appropriate throughout the Results
and Discussion.)
- Present all of the results of
the experiment in table form.
- Try to make your results tables as
concise and well organized as possible. If at all
possible each table should be confined to a single
page. Tables may be single-spaced if necessary to
accomplish this.
- Number and title your tables. The
title should give complete information about the
data contained in the table.
- Include the structures of the
compounds listed in the tables between the title
and the main body of the table.
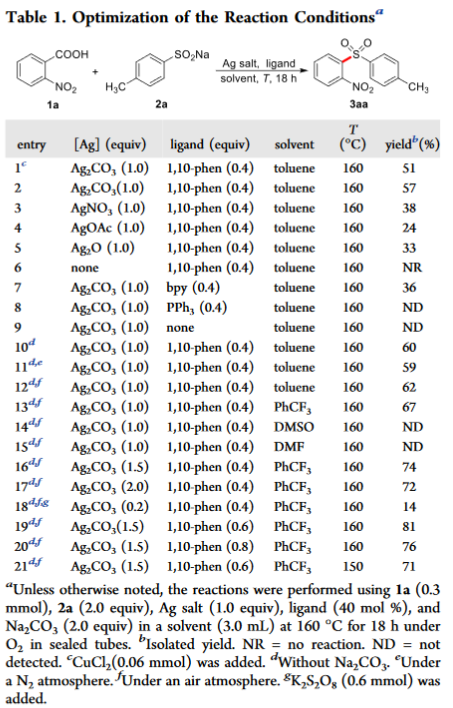
- See any current issue of the
Journal of Organic Chemistry or this screenshot
from a recent paper for an example of how to
format your tables.
- Include the yield (mass), theoretical
yield, and percent yield (rounded to the nearest whole
number) of any product obtained. (Show the calculation
of theoretical and percent yield on an attachment.)
- A melting point range should be
reported for every crystalline solid product.
- Include literature values for any
physical constants measured (mp, bp, refractive
index).
- Indicate units where required. (A
well-organized table gives the units in the column
headings rather than repeatedly throughout the table.)
- Make sure to observe the significant
figures convention! Significant Figures Tutorial
- Use footnotes as necessary to fill in
missing details or to give definitions of any
non-standard abbreviations used in the table.
- Spectroscopic Results
- Include tables that summarize the
spectra obtained (NMR, IR, MS). These tables should
list all peaks
observed and their key characteristics.
- IR. Round peak frequencies to
the nearest 1 cm-1. Describe each
peak as vs (very strong), s (strong), m
(medium), w (weak)
- MS. Round peak m/z
values to the nearest whole number. List the
approximate percent abundance of each peak (as
compared to the base peak).
- C-13
NMR. Round peak shifts to the nearest
0.1 ppm except when greater precision is
needed to distinguish closely spaced
peaks.
- H-1 NMR. Round
off peak shifts to the nearest 0.01 ppm. Make sure to also
state the multiplicity and integration value of
each peak.
- Always include a column for "peak
assignment".
- For NMR the assignment should be
a letter that refers to a labeled chemical
structure included with the table.
- For IR the assignment should
refer to the specific type of bond vibration and
the functional group family, e.g., C=O (ketone),
C=O (anhydride), O-H (alcohol).
- For MS, the assignment can take
form of describing the neutral fragment lost,
e.g. M - CH3, M - Br, or preferably
show the structure of the cation detected
- Do not include solvent peaks (e.g., H2O,
CDCl3) in NMR tables.
- Do include literature values of
chemical shifts, wavenumbers, and m/z when
available. Use a superscript number to cite the
reference. (See the part on references below)
Figures
- In this section include images of the
obtained products as well as any other photos you took
throughout the lab period that can be used to
illustrate your results.
- Also include graphs where appropriate.
- Do not include images of your spectra
as these are to be provided in the Supporting
Information.
Results and Discussion (R&D)
- This section is referred to as "Results
and Discussion" because the proper way to go about it
is to state some results and then go on to discuss
them.
- Make sure to actually state the results
to be discussed rather than just refer to a table. For
example, even though your Table 1 might show the
observed and literature mps for your product, your
R&D part should start out as, "The mp of the
product was found to be XX in comparison to the
literature value of XX. (Table 1)"
- After stating the results, go on to
explain your interpretation as to how they align with
the theory behind the experiment.
- Make liberal use of structural
diagrams, equations, curved arrows, images of
molecular models, etc., to illustrate points being
made as appropriate.
- For puzzling results that do not seem
to fit the theoretical expectations, are there valid
explanations for them?
- This section should include answers to
the assigned questions. Make sure to explain all
answers completely even if the question does not ask
for an explanation.
- Above all, make sure your answers and
interpretations make sense! Do not just take a stab at
interpreting the results! If uncertain, do some
Internet and/or library research or ask the instructor
if you are on the right track.
- For synthesis experiments always
discuss:
- Yield - Actual
yield of product versus the theoretical yield
(percent yields) and possible reasons for loss of
yield. Please see this page for more info: Yield Reporting and
Discussion
- Spectra Interpretation
- Evidence for the structure of the product from
NMR, IR and/or chemical tests.
- Purity - Purity of
the product as indicated by mp, bp, NMR,
etc. Identify impurities that are present if
possible, explaining thoroughly the reasoning
behind your conclusions.
References
- Give sources for all literature values
as well as for any other background information
included.
- List the references in the order they
are cited in the report.
- Give each reference its own number (in
parentheses). Use these numbers in superscript form to
cite the appropriate reference throughout the report.
(For example, in the results table the references for
the literature values should be given.)
- Use ACS style for your references list.
See https://libguides.williams.edu/citing/acs
Supporting Information
-
Calculations - An example of each
non-trivial calculation, including % and
theoretical yield calculations, should be
shown. Do not include trivial calculations such
as subtraction of tare weights.
-
Spectra - Attach printouts of all
spectra obtained. Make sure the spectra are
completely labeled (name, date section number, expt
number and title). Label all peaks on the NMR
spectra. By labeling all solvent peaks and other
expected extraneous peaks (e.g., TMS, water) you
make clear what they are without unnecessarily
devoting lab report discussion to them. For IR and
Mass spectra it is not necessary to label small
unidentifiable peaks especially those in the
fingerprint region of the IR.
Team Contribution Surveys (TCSs)
- These are made available on D2L the
same day the lab report is due for each experiment.
They are due within one week of the lab report
submission.
|